How To Operate
Dashboard
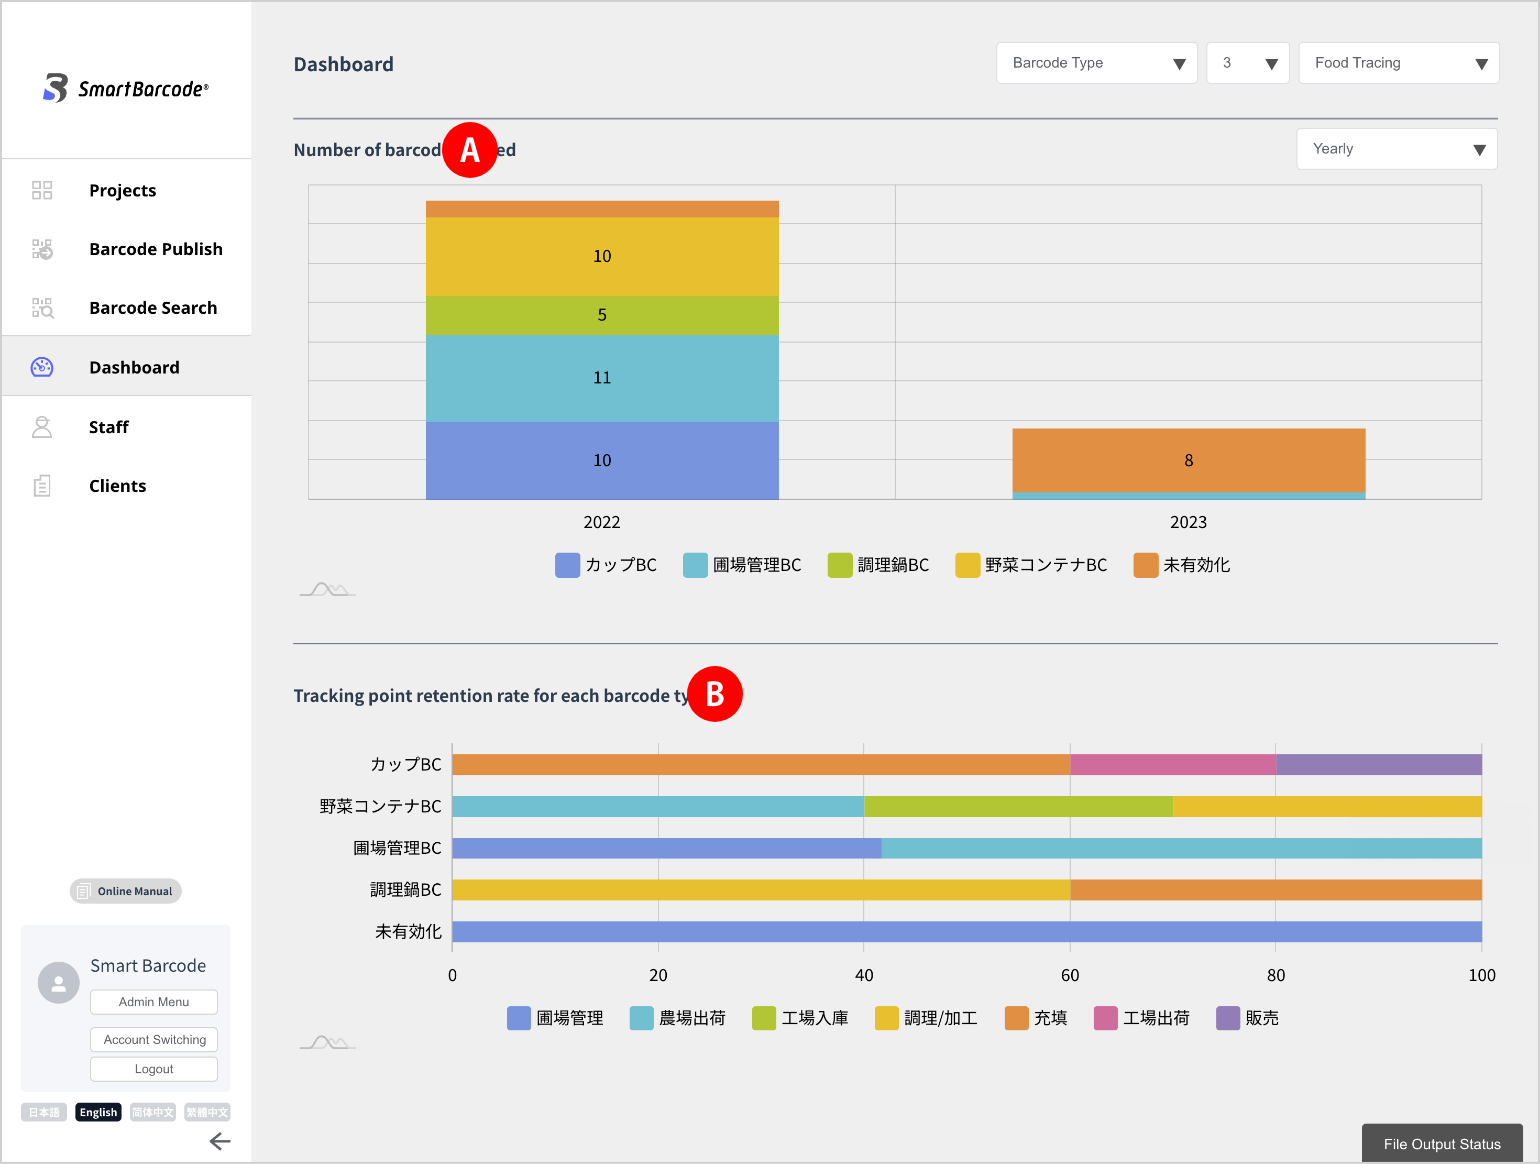
You can visually check the operating status of barcodes from the Dashboard side menu of the Management screen.
Initial Screen
On the default screen, you can check the number of barcodes issued
and the tracking point retention rate for each barcode type.
Customizing The Display Screen
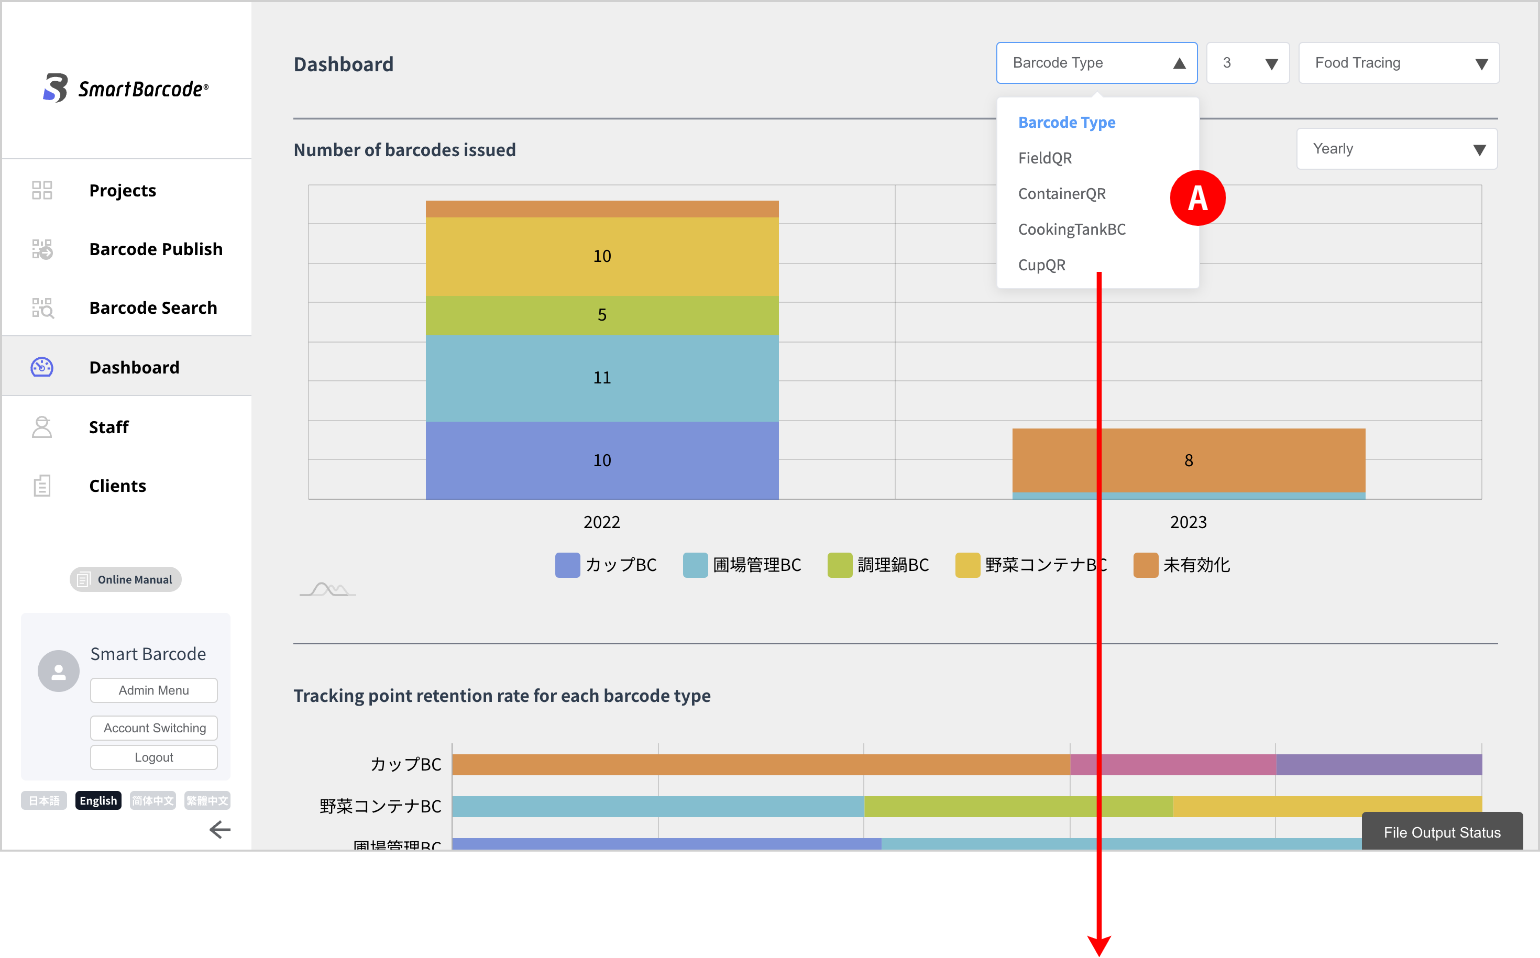
You can add graphs with your favorite settings on the individual barcode screen.
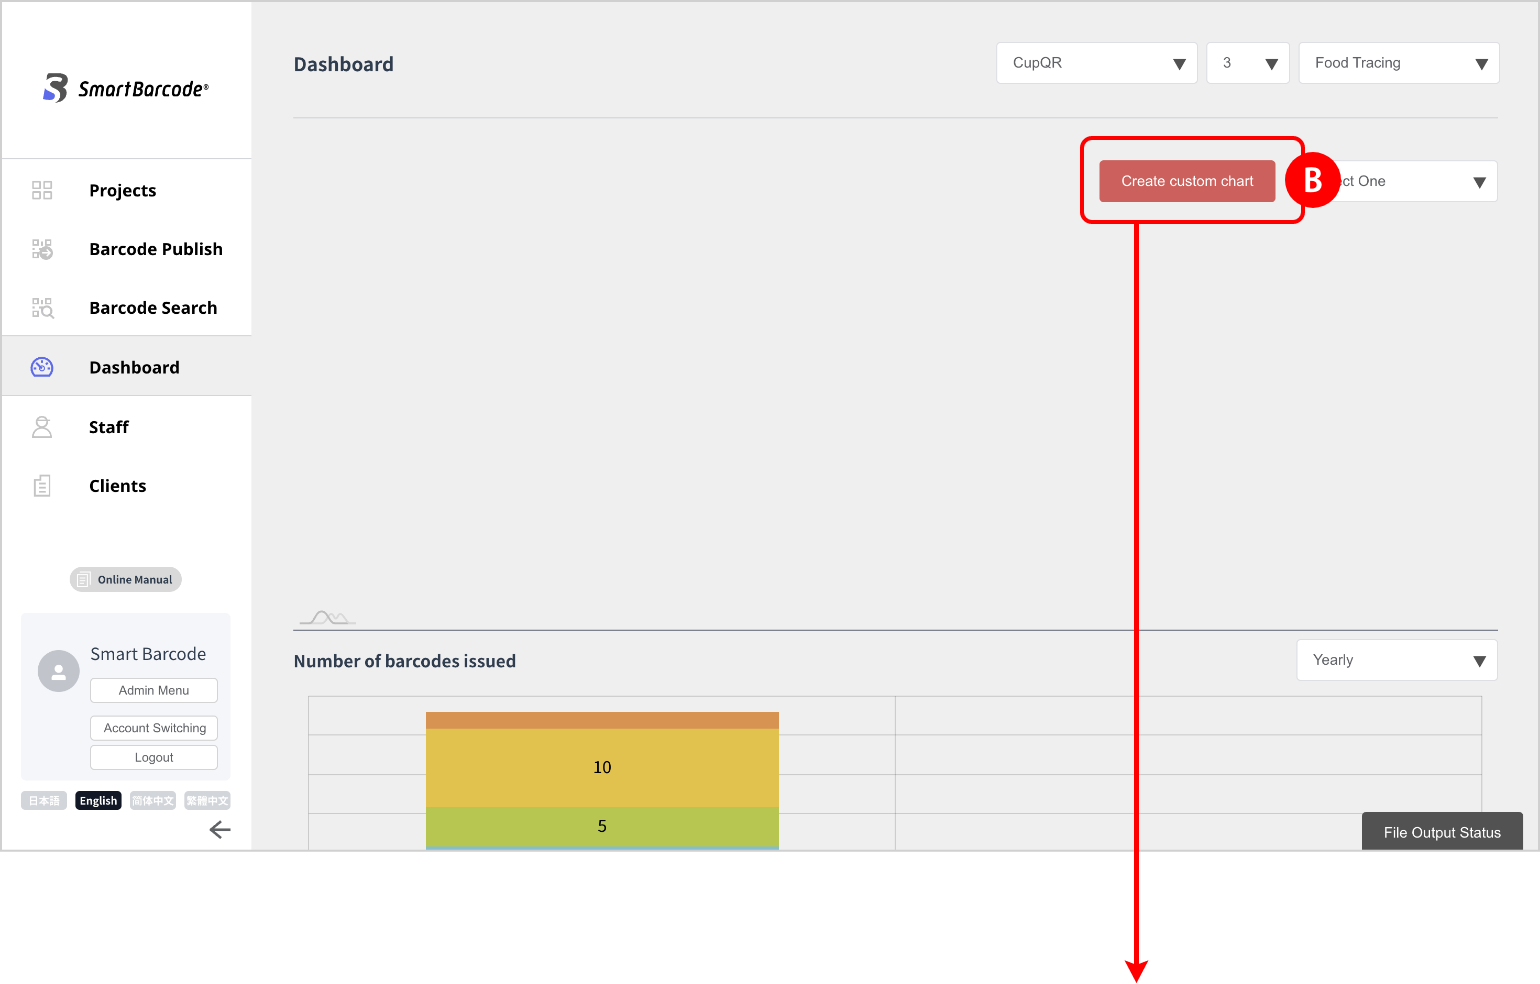
When you click the “create new graph” button, a dialog will appear, and a new graph will be added just by setting each item.
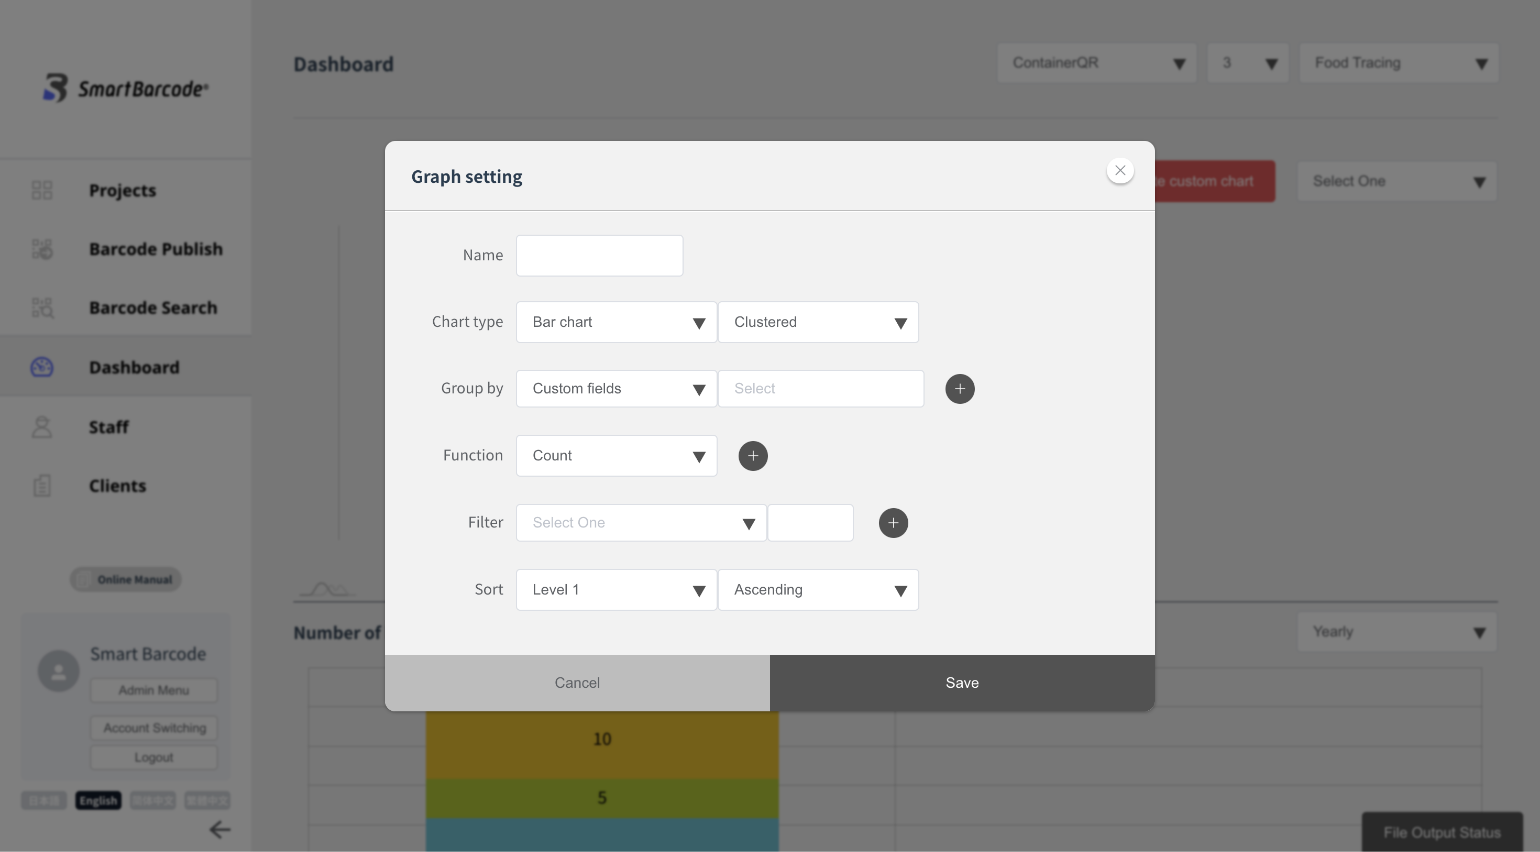
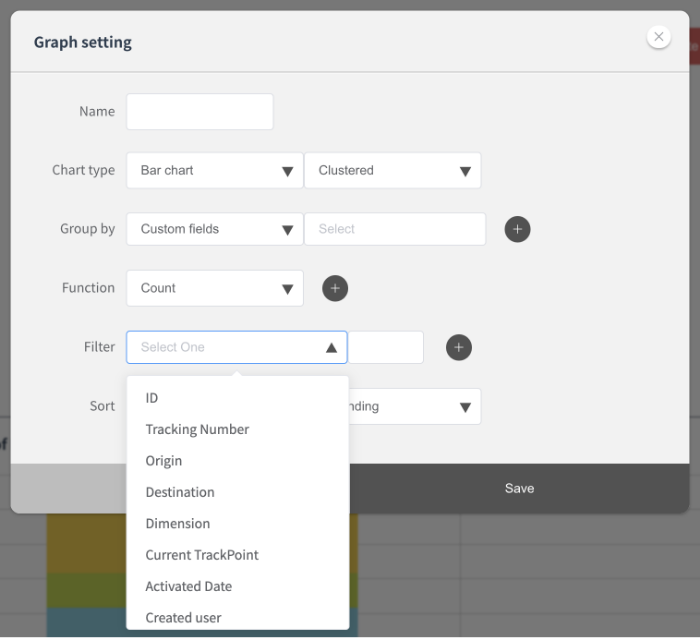
(3) Setting the graph parameter
The following items can be set:
・Name
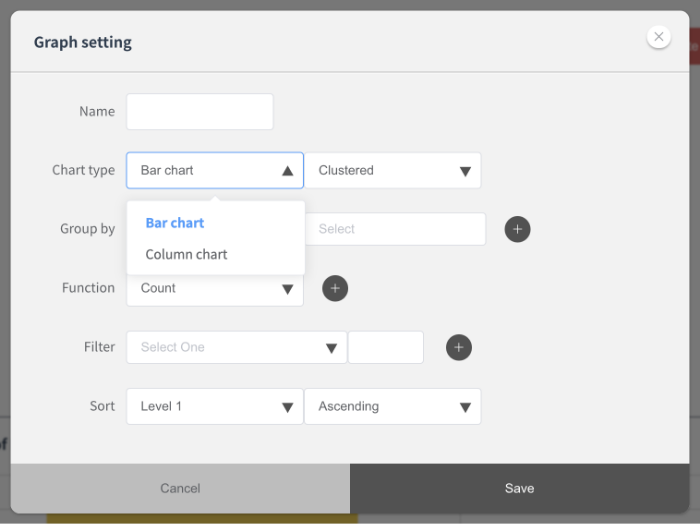
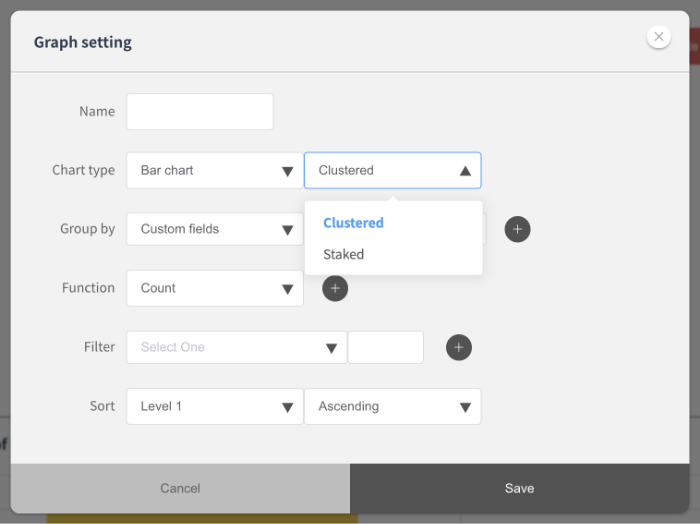
・Type: bar chart and column chart can be selected.
You can select cluster and stacked (stack) as attributes.
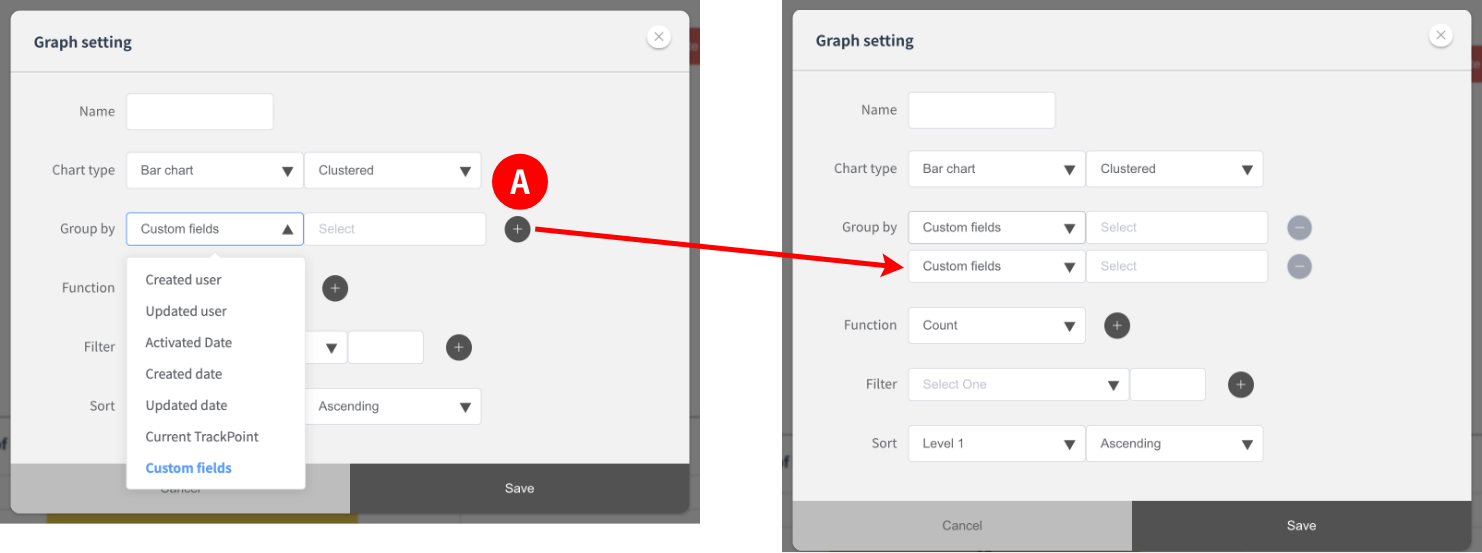
・Items to categorize: select from the pull-down list
You can add conditions with the + button
on the right.
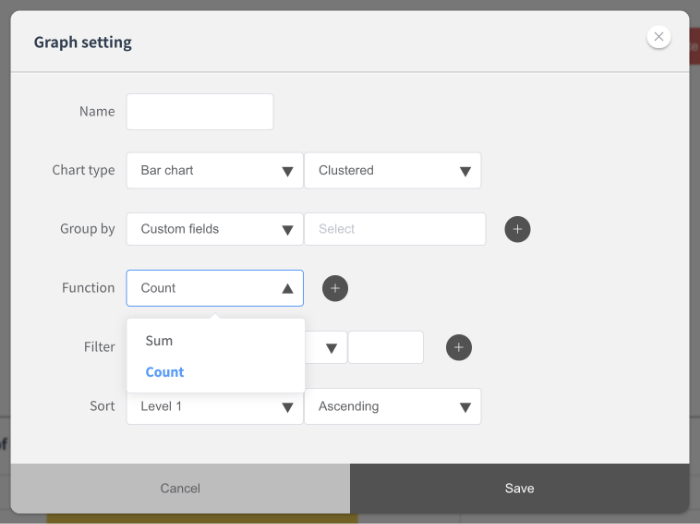
・ Aggregation method (s): you can select count (number of cases) and sum (aggregation).
・Conditions: select from the pull-down list
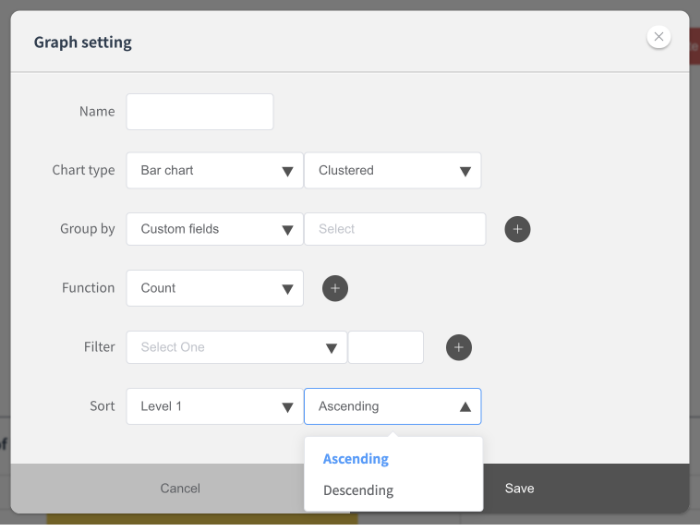
・Sorting: you can select ascending and descending.
Graph Setting Example
For example, if you want to visualize the shipment status of products by receipt date,
You can make a graph with the following settings.
・Name: Shipment status by receipt date
・Type: Bar Graph/Cluster
・Items to classify: Recorded items (custom fields) / Receipt date / Daily unit
・Aggregation method: count (count)
・Condition: Current tracking point / shipment completed
・Sort by: Ascending
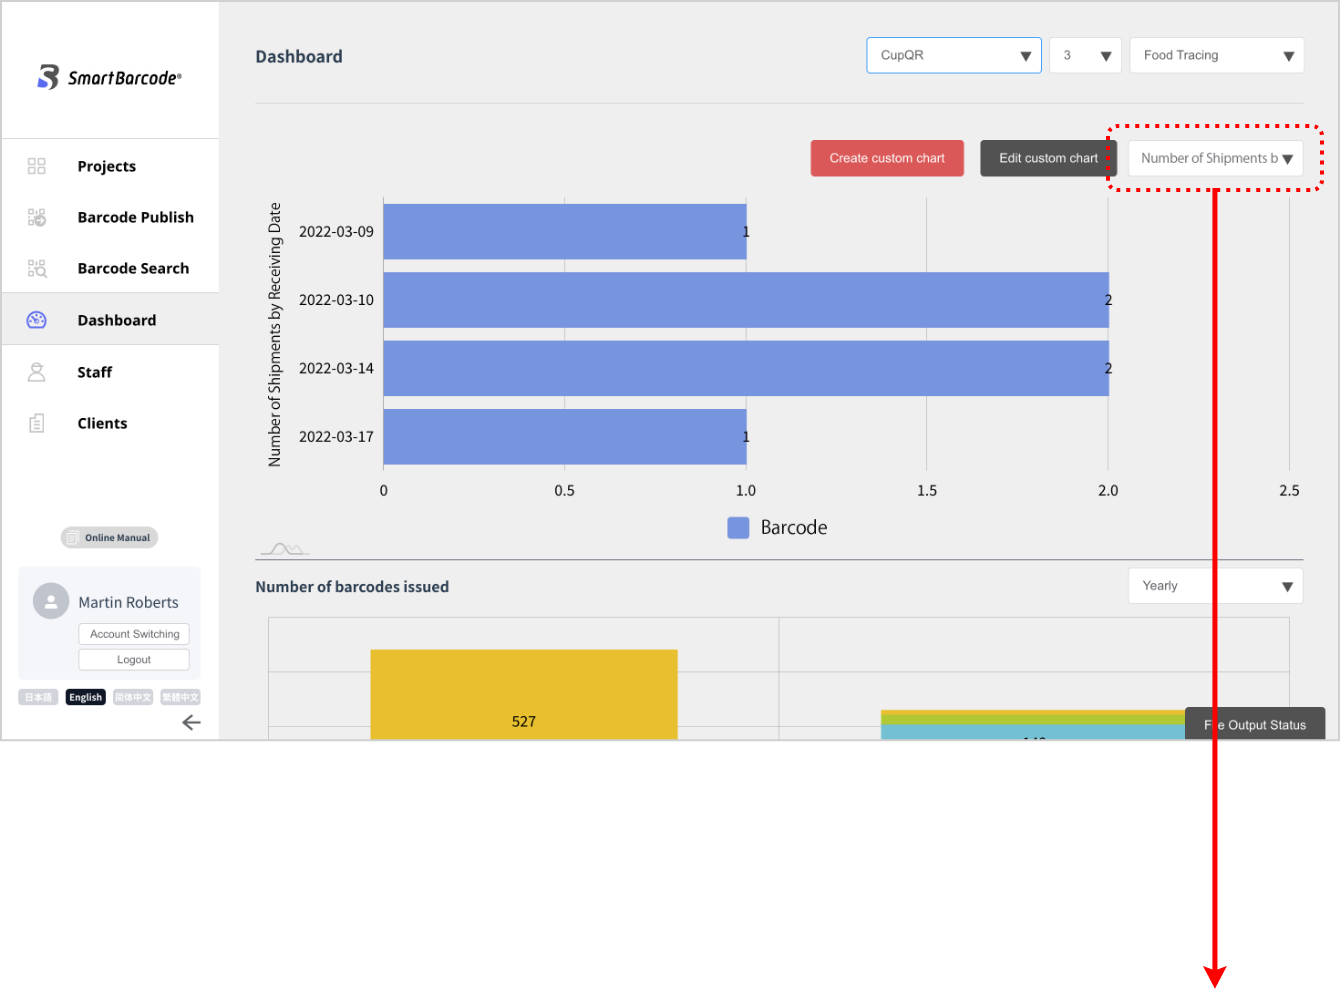
The graph you created is saved.
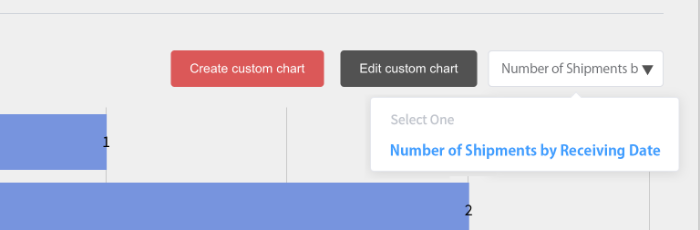
It will be listed in the pull-down to the right of the “edit graph” button.
From the next time, you can display it at any time just by selecting it.